This article describes how to compare scans and models in Cintoo.
Permissions: users with roles including View Reality Data permission can use Comparison Tools.
TABLE OF CONTENTS
- Selecting Data Sets to Compare
- Visual Diff Tool
- Explaining Color Map Tolerancing
- Visual Check Tool
- Closing Comparison Tools
Selecting Data Sets to Compare
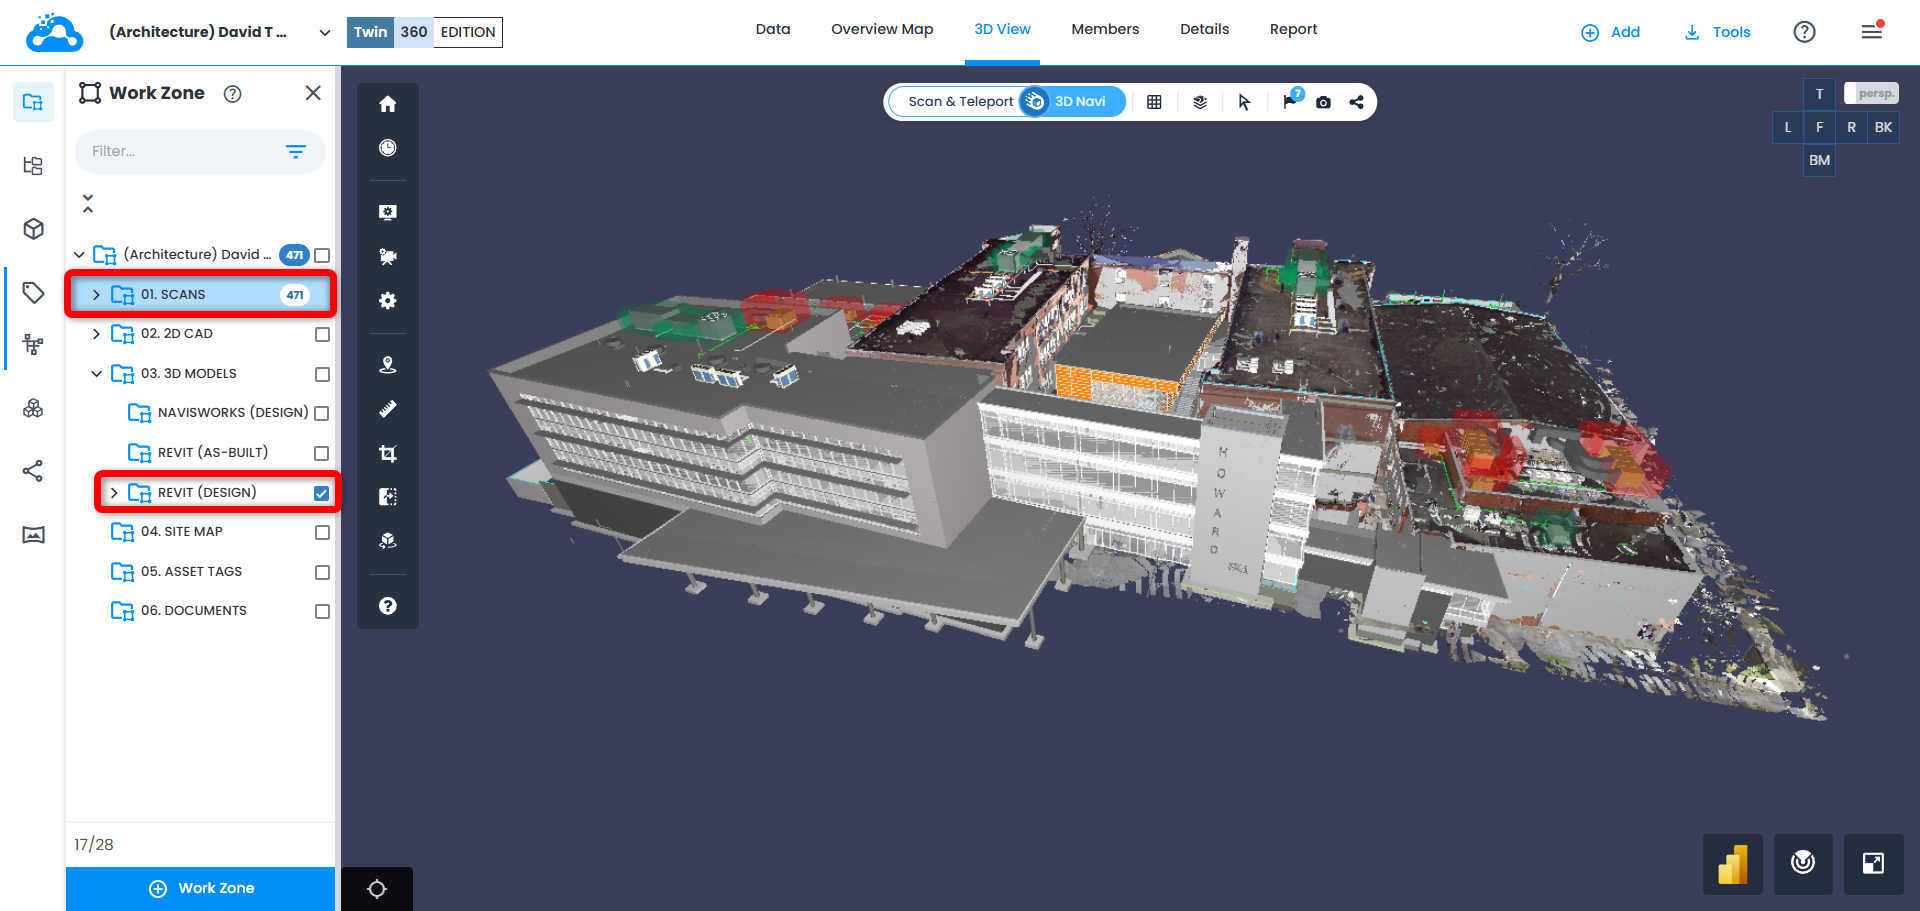
1. In Work Zone Explorer, confirm that work zones containing data sets to be compared are toggled on, and 3D data is visible in 3D View.
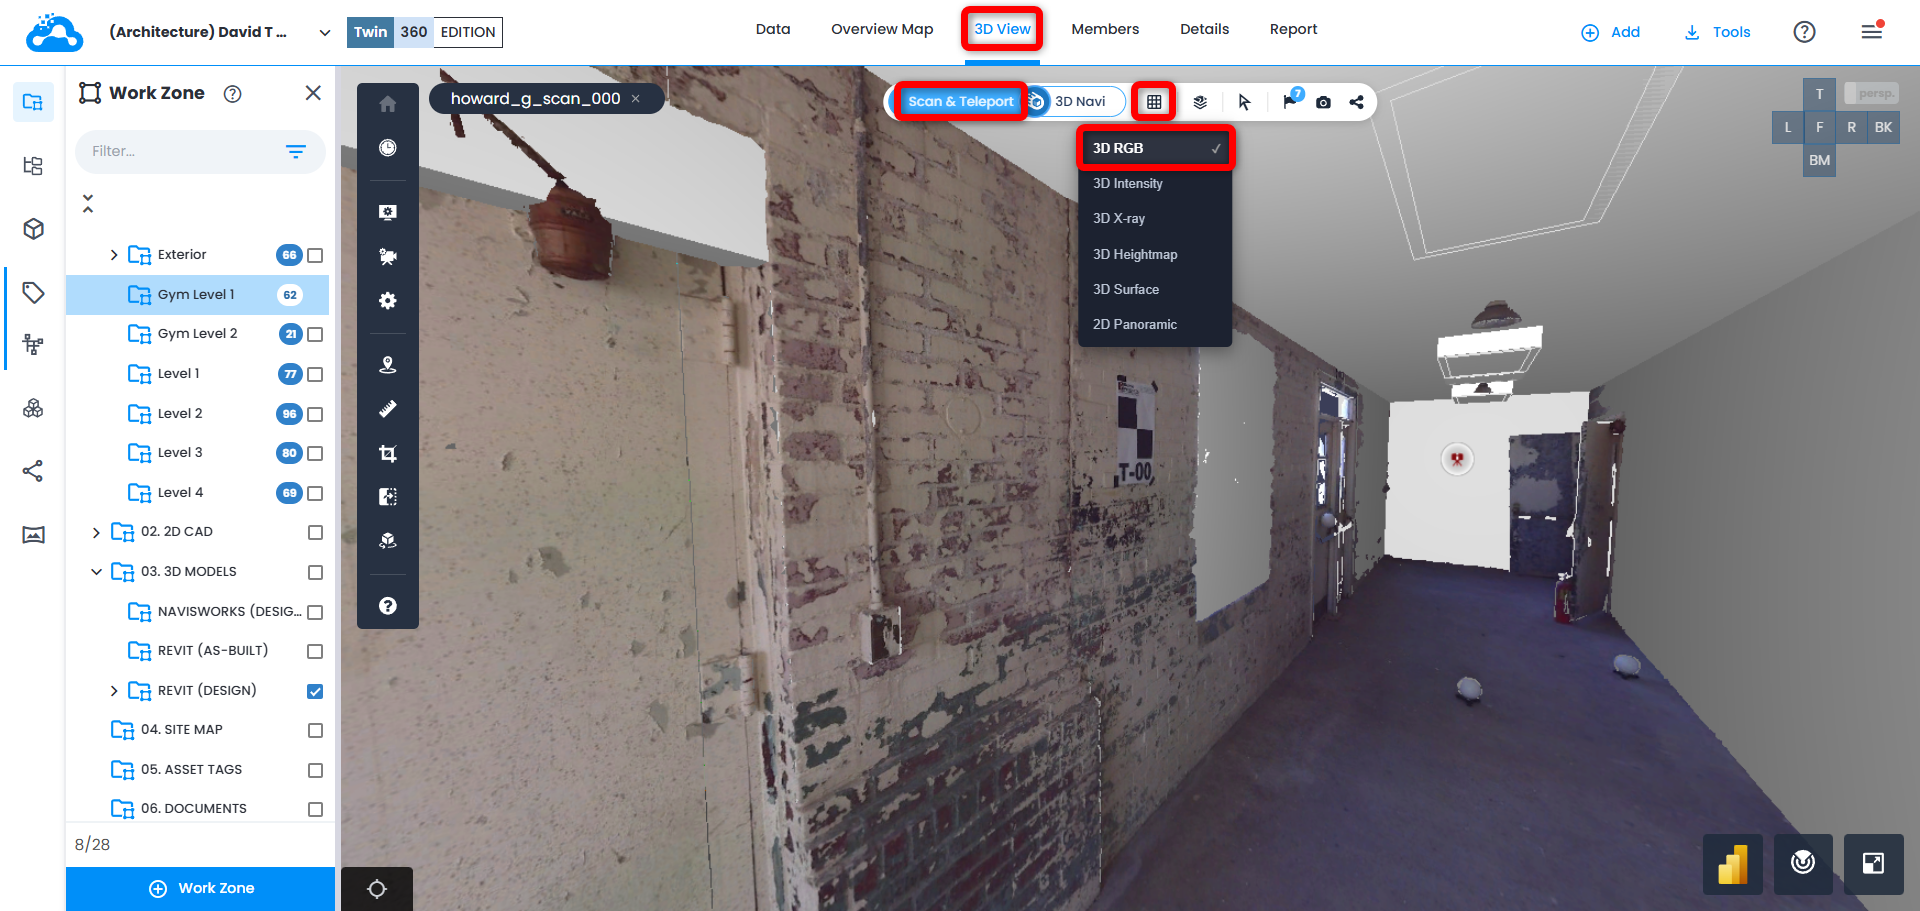
2. If 3D View is open in 3D Navi mode, switch to Scan&Teleport and set display setting to 3D RGB.
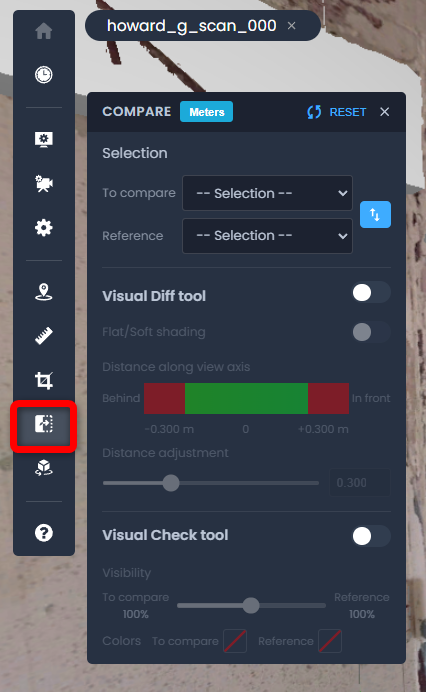
3. Click Comparison Tools icon in the left toolbar.
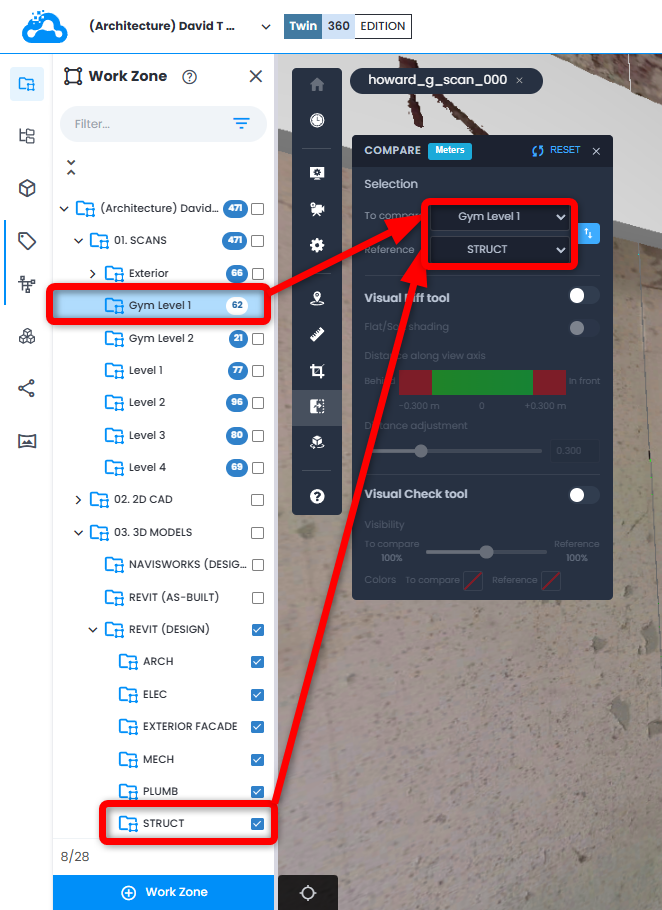
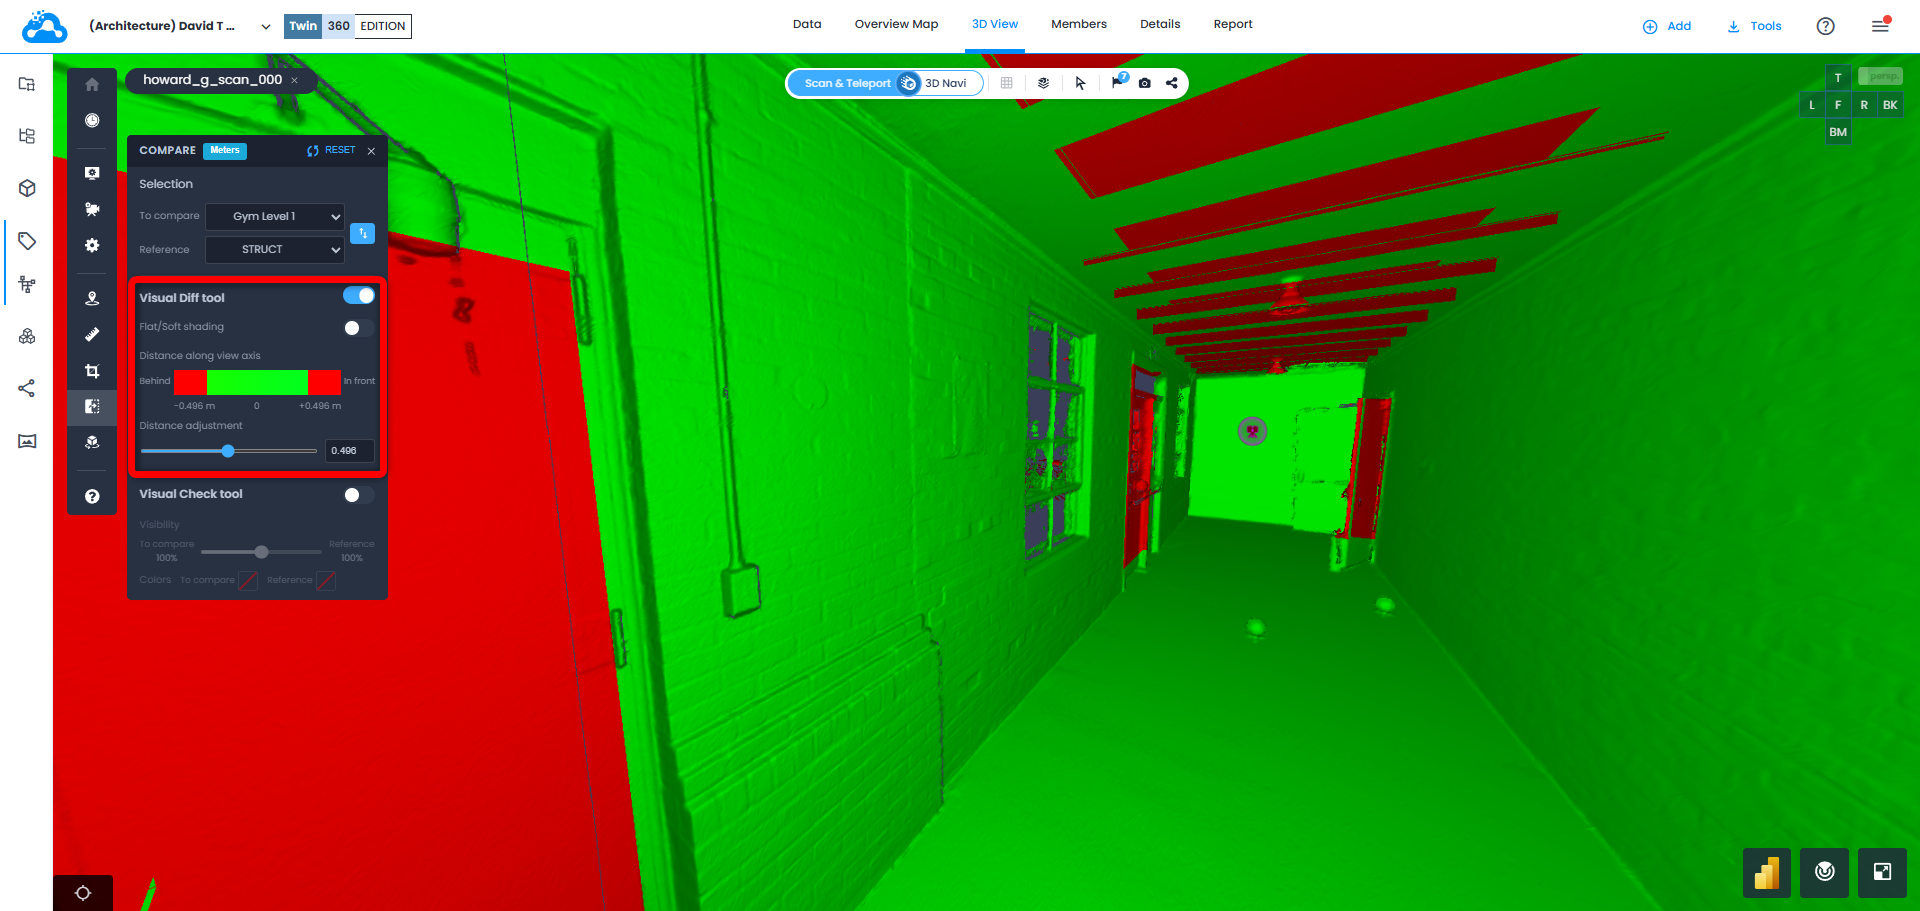
4. In Selection field, assign which scans (or All Scans) will be used To Compare, and which model (or All Models) will be used for Reference. Selections in Comparison Tool will be limited to whichever work zones and sub-work zones are toggled on in Work Zone Explorer.
Visual Diff Tool
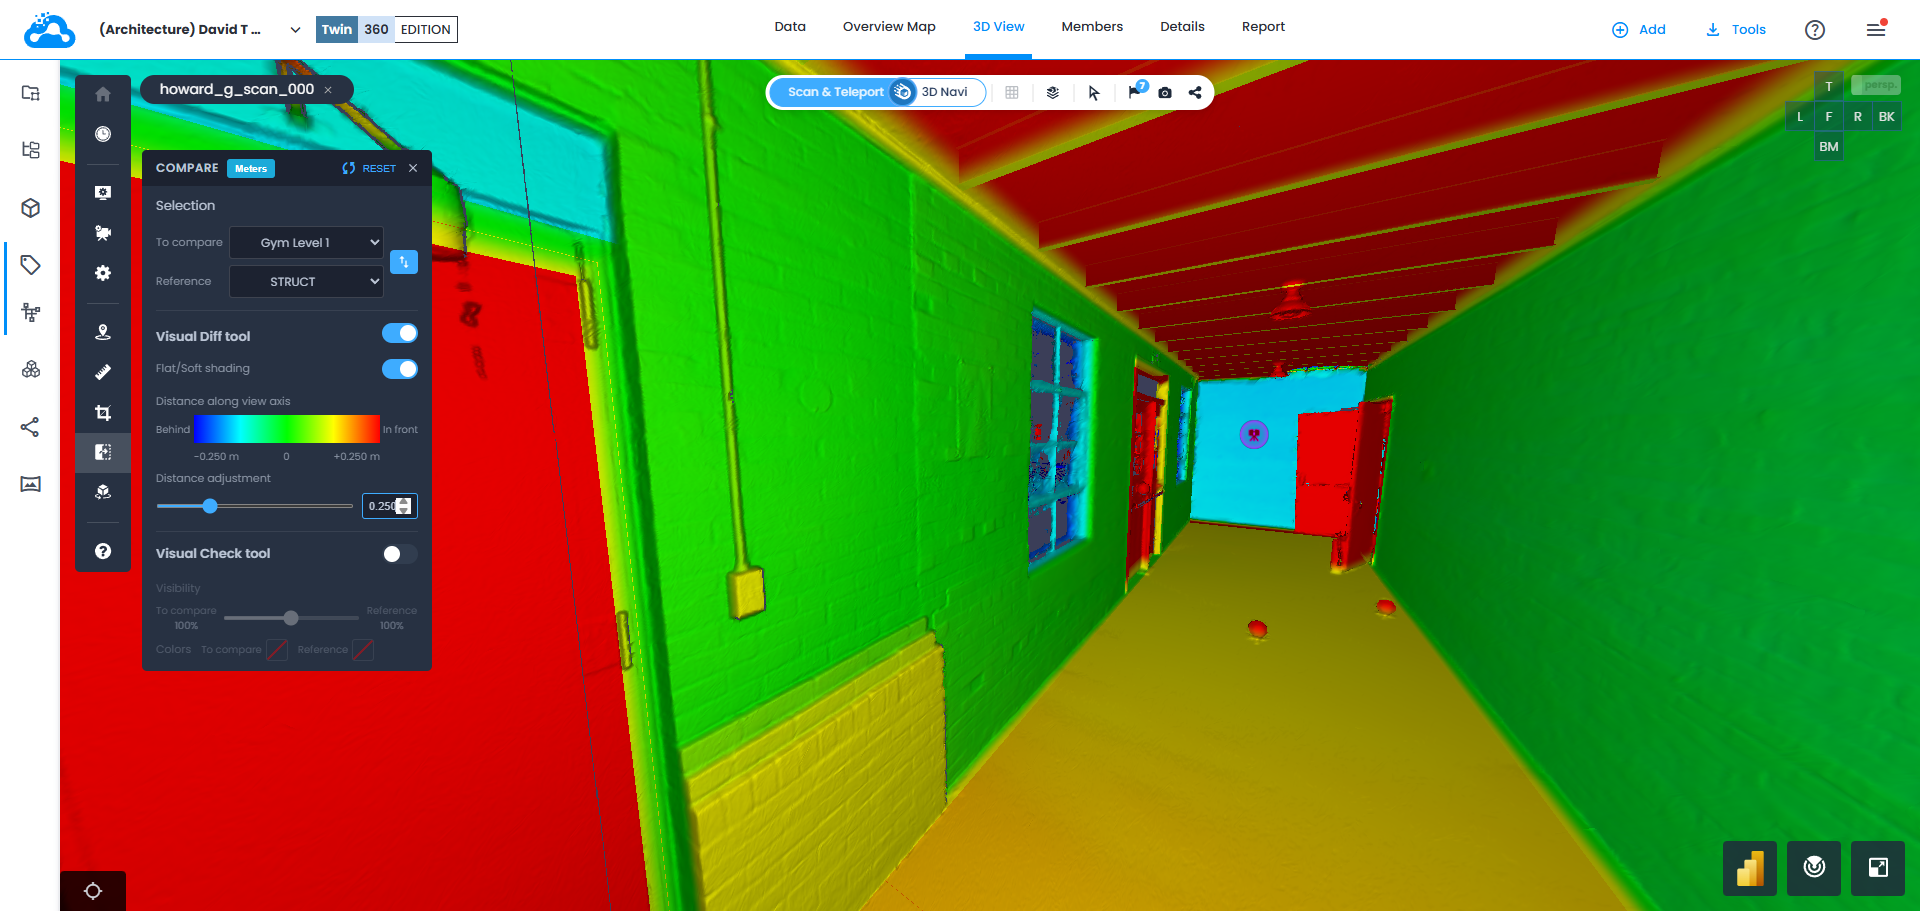
1. Toggle on Visual Diff Tool. A heat map is generated that highlights the differences between scan data and model data.
2. Make sure that units in the project are set up correctly in Options menu.
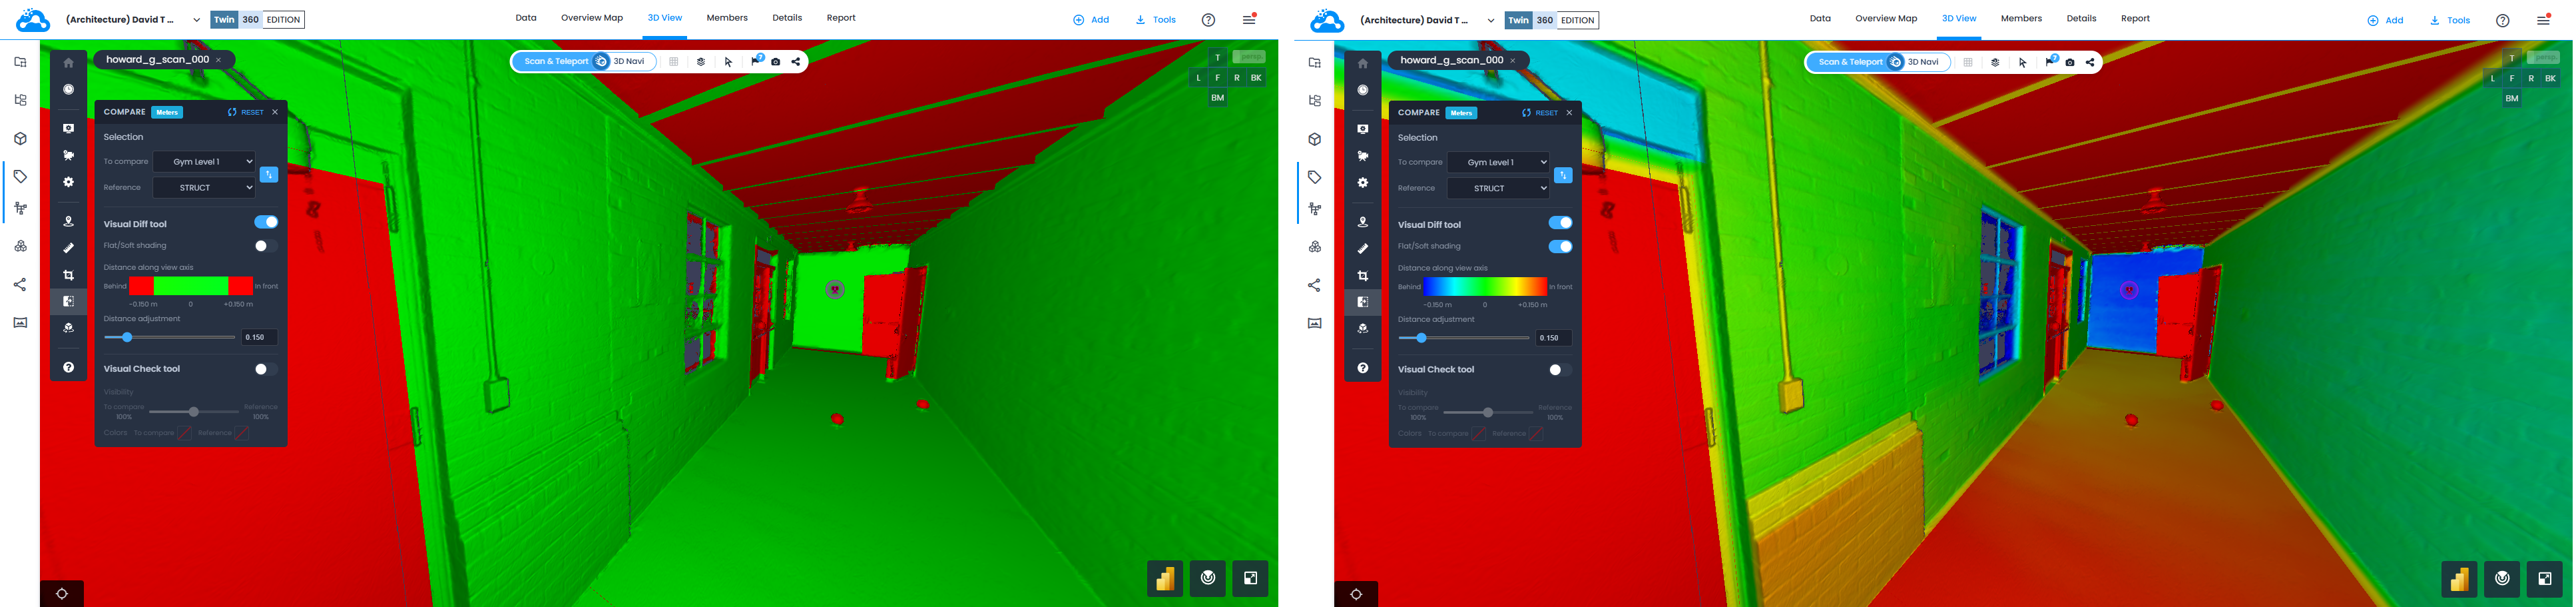
3. By default, heat map will be displayed in Flat Shading mode, or bi-color/green-red. It is possible to change display setting to a gradient by selecting Soft Shading.
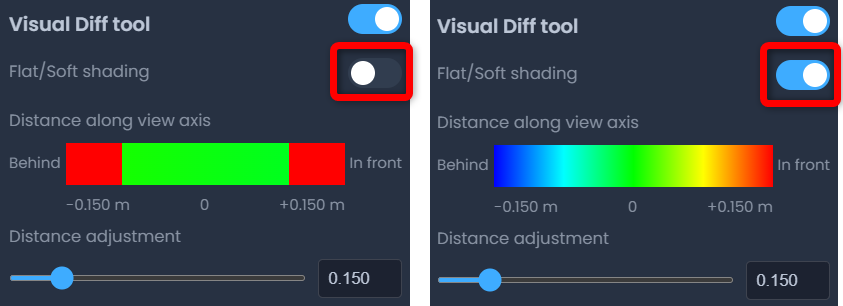
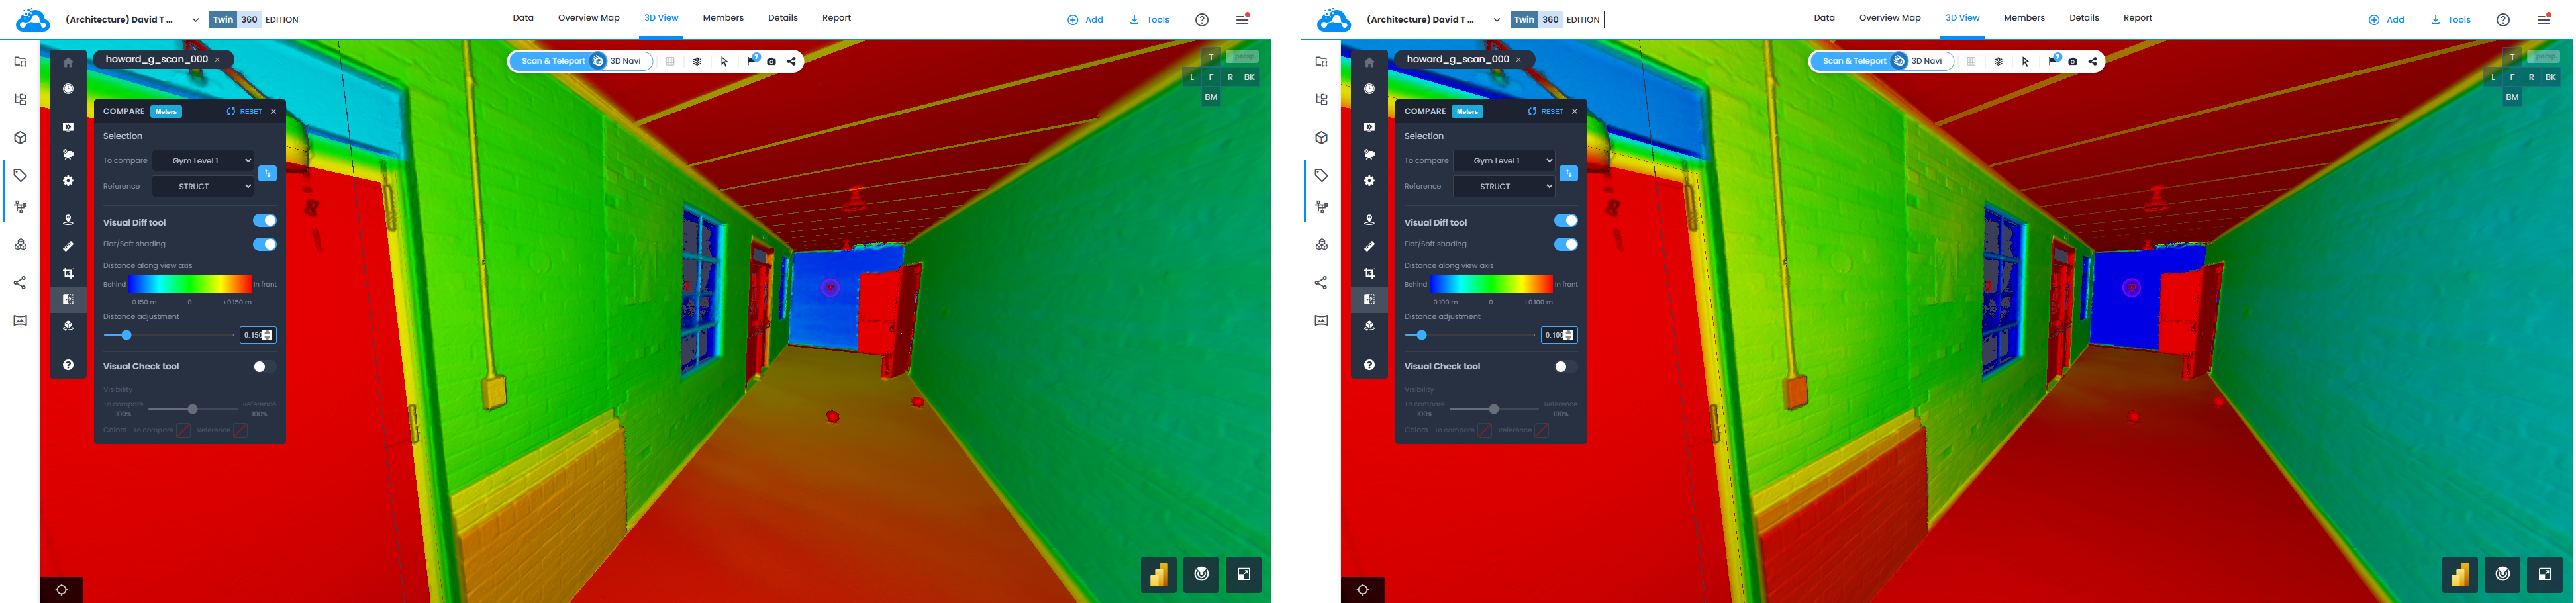
4. Modify Distance Adjustment setting to adjust tolerance range by using the slider or by typing a value (in this example, from ± 0,150m down to ± 0,100m).
Visual Diff Tool colorizes either scan data or model data based on which information is in front, superimposed, or behind the other in viewer’s line of sight. In this example of scan vs. model, scan data is colorized.
Explaining Color Map Tolerancing
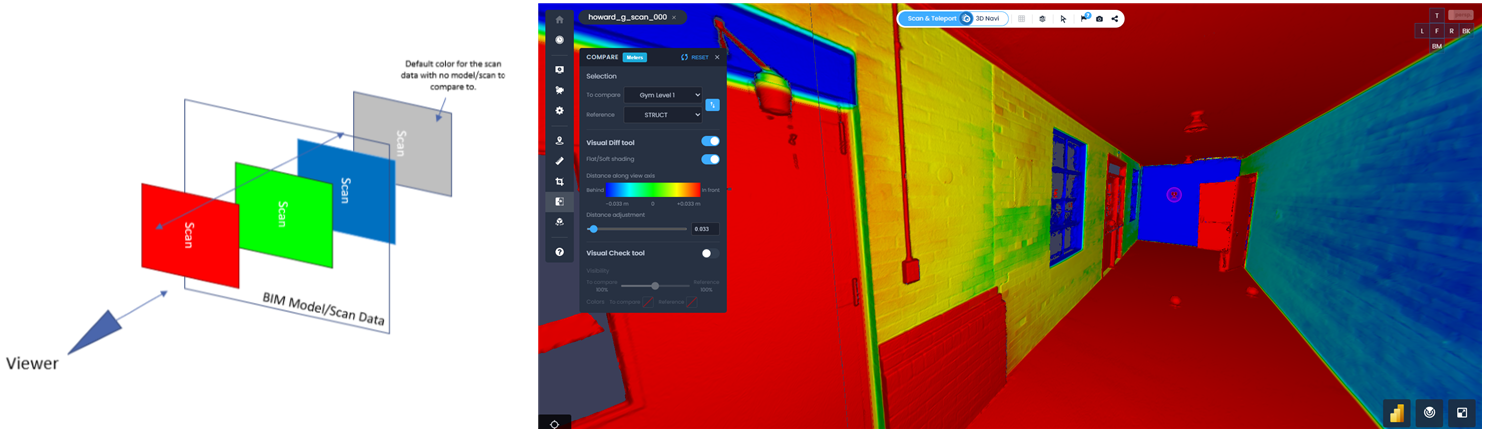
All comparisons are based in a range field of tolerancing (Standard Reference ASME 14.5Y-2078):

- Hot Colors (between Green and Red: [Yellow, Orange, Red]) means that point cloud is above the surface of the BIM Model until the border of the tolerancing field (in Red).
- Cold Colors (between Green and Blue [Blue Green, Cyan, Dark Blue]) means that point cloud is under the surface of the BIM Model until the border of the tolerancing field (in Dark Blue).

- Everything red is in front of the BIM model at a distance higher than the value defined in Distance Adjustment.
- Everything green means that the scan data and the BIM model are within the range of the value defined in Distance Adjustment.
- Everything blue is behind the BIM model at a distance higher than the value defined in Distance Adjustment.
Visual Check Tool
1. Toggle on Visual Check Tool.
When Visibility slider is moved to the middle, both data sets being compared are visible (i.e., opacity of each one is 100% and both are visible).
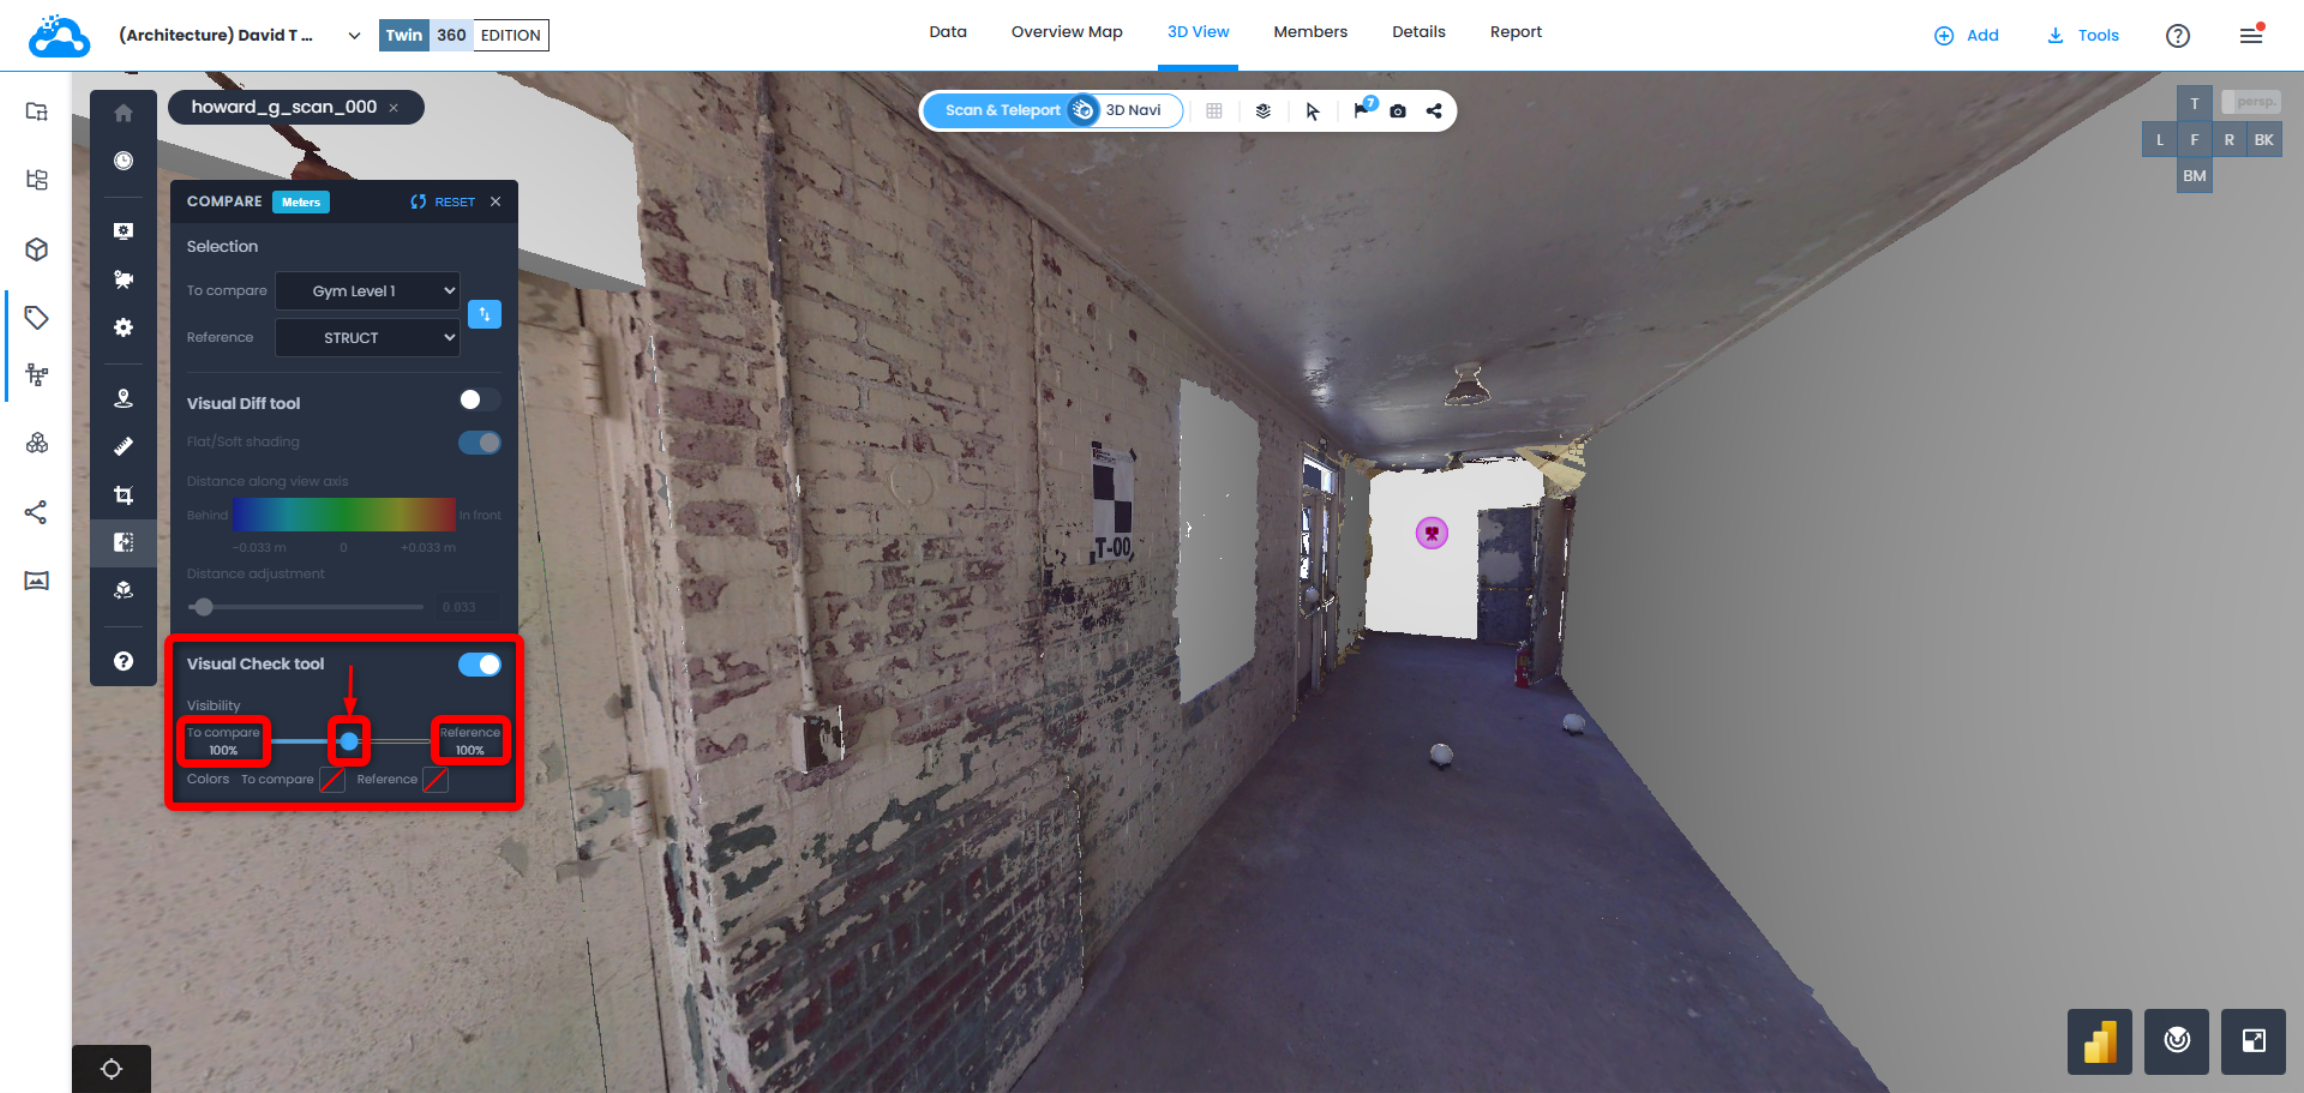
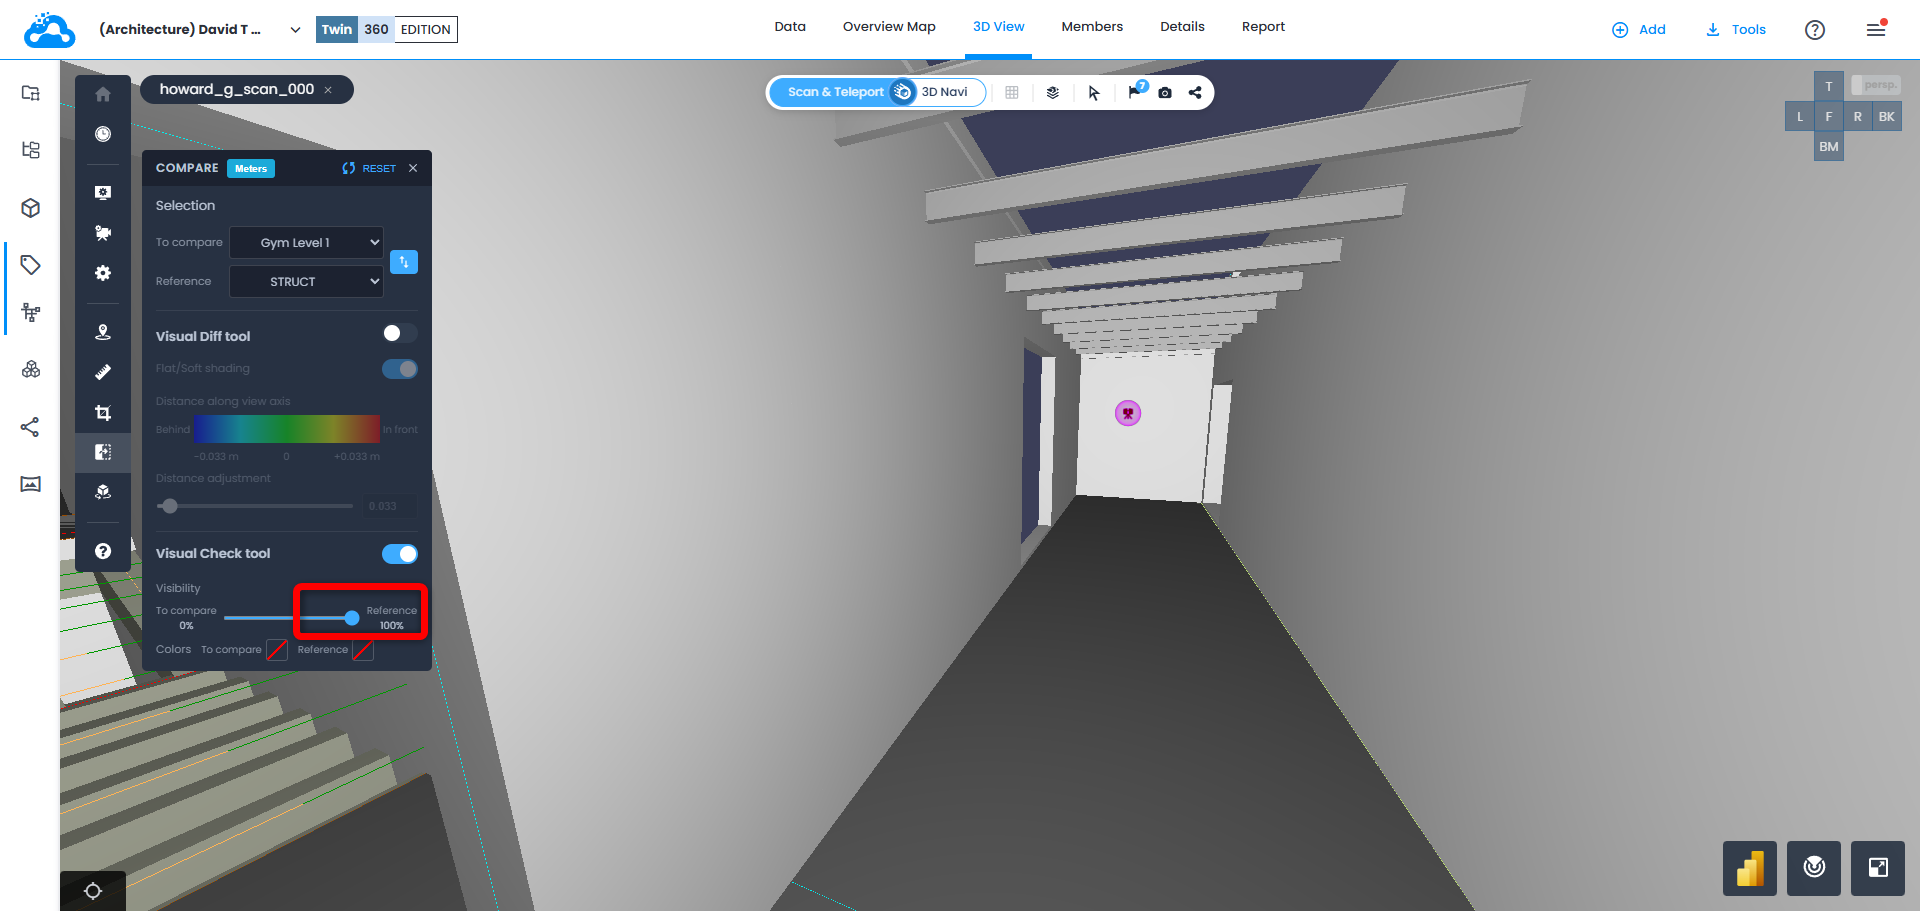
2. Use Visibility slider to control transparency/opacity of each data set being compared.
When slider is moved all the way to the left, only the data set To compare will be visible.
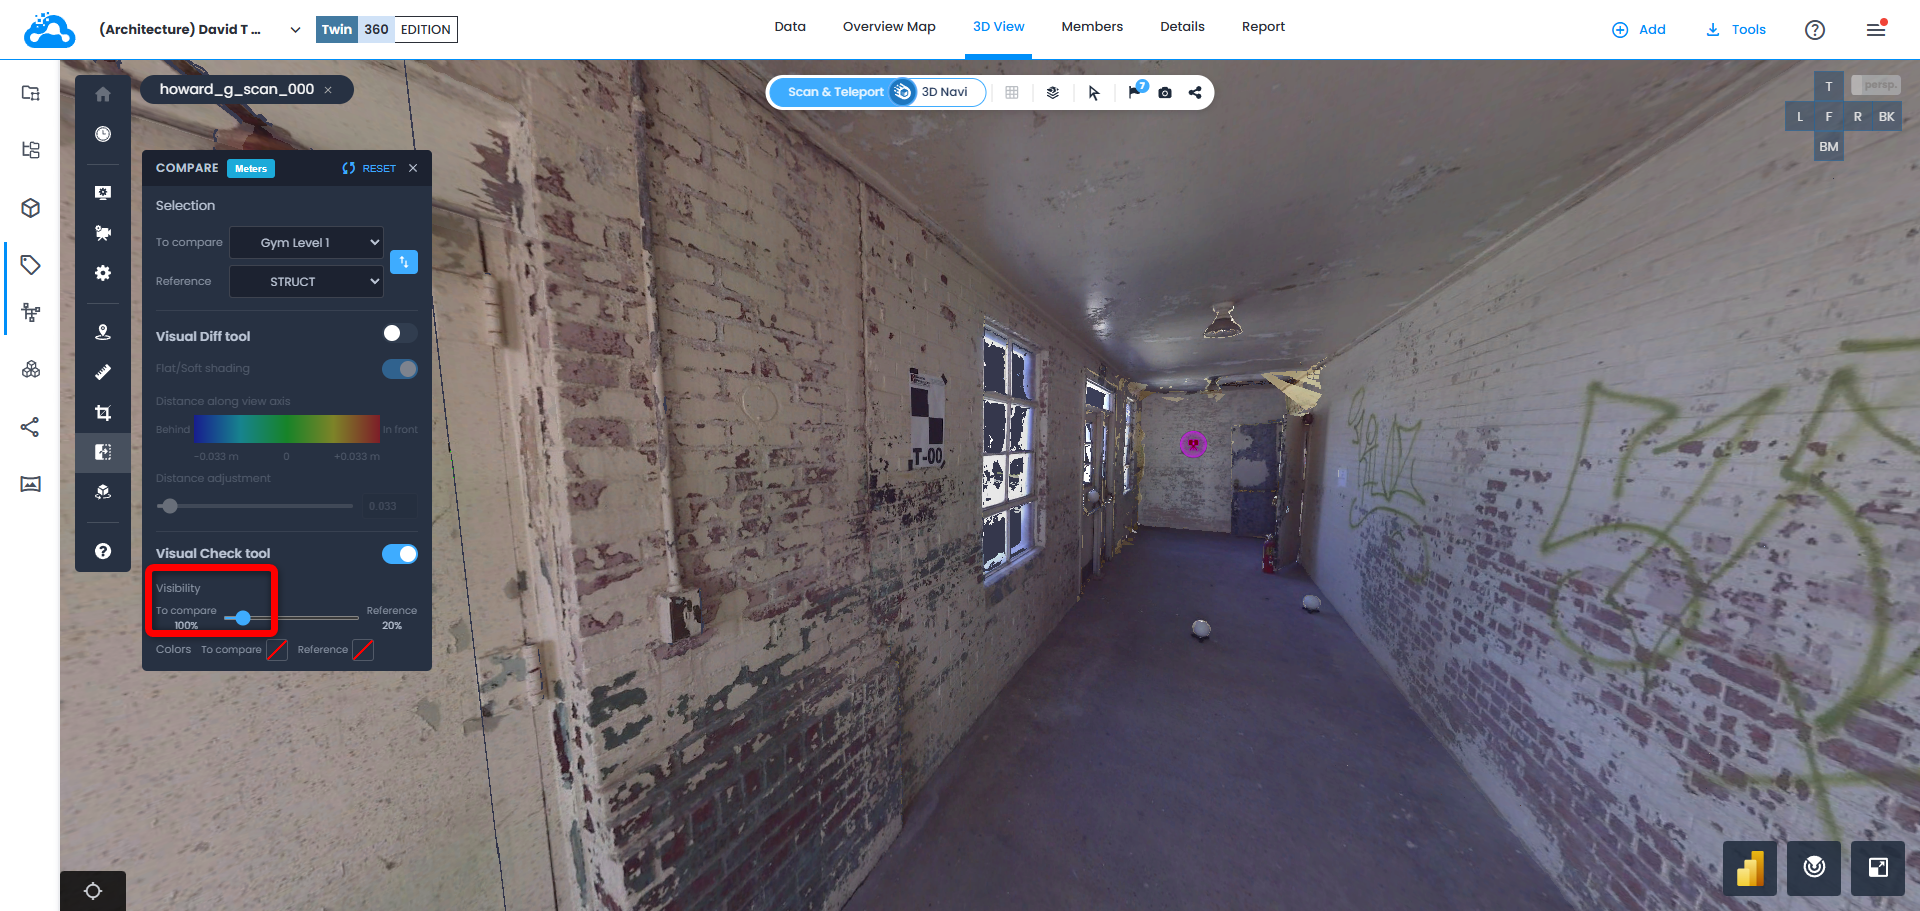
When slider is moved all the way to the right, only the data set Reference will be visible.
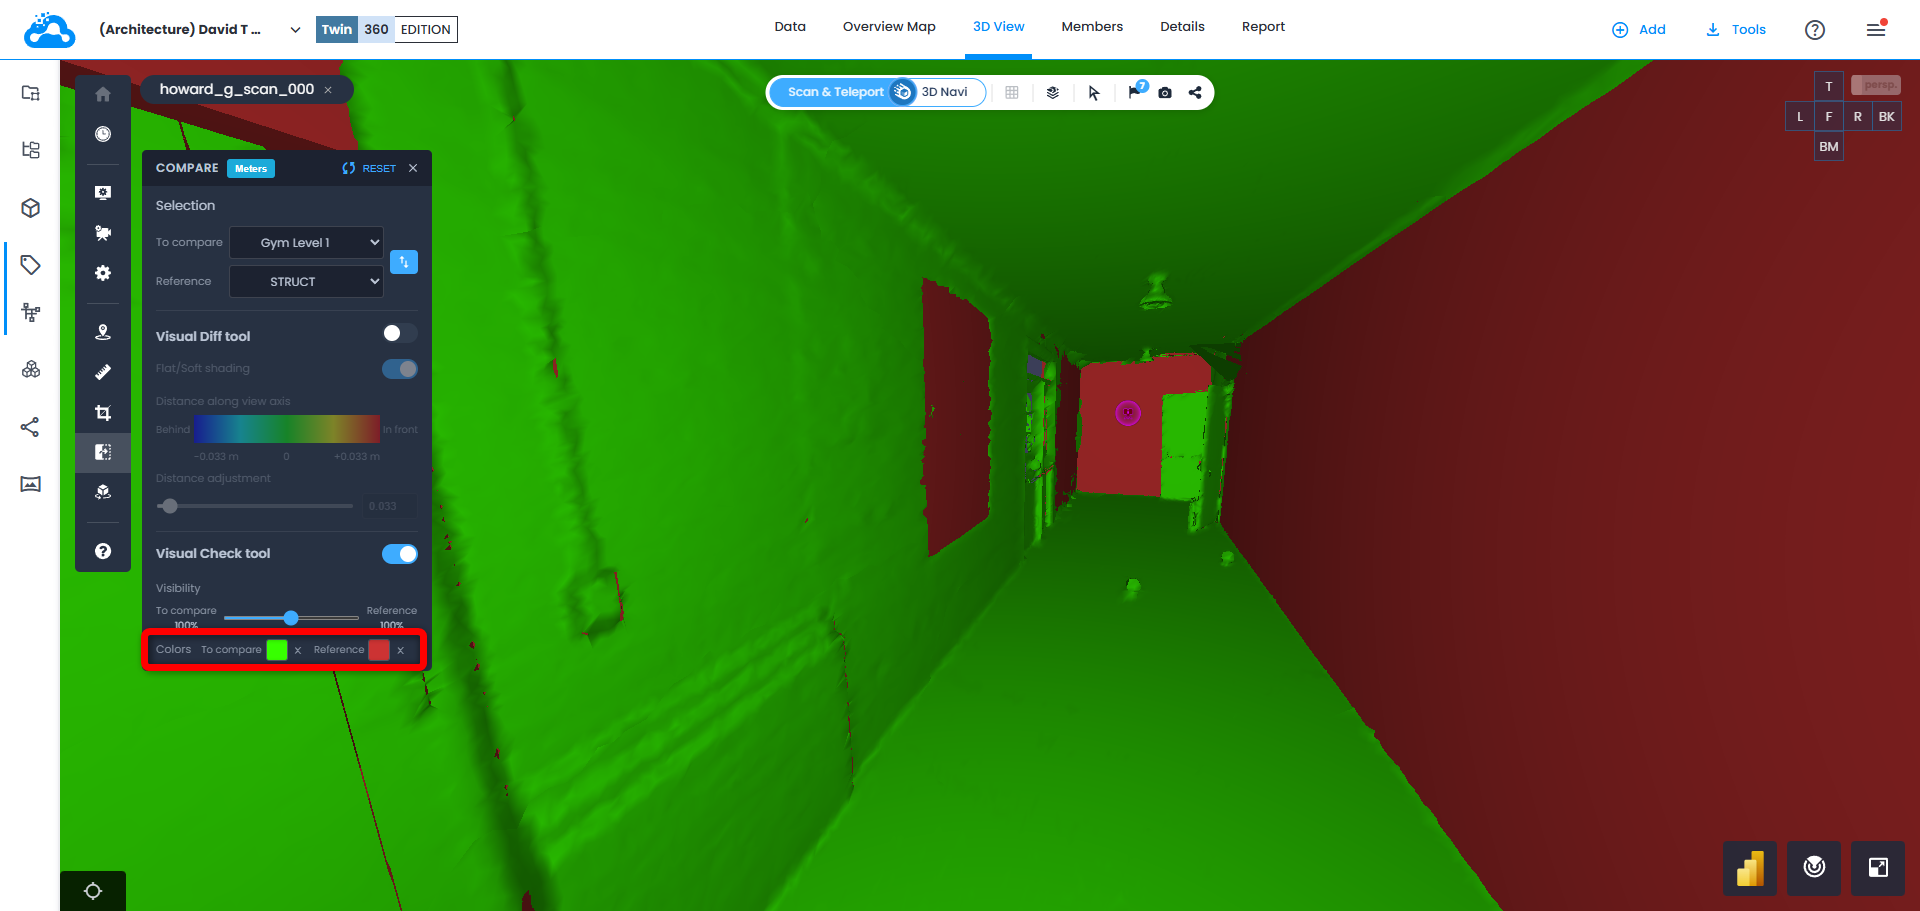
3. Color overrides can be applied to each data set in 3D View to easily identify which elements belong to which data set.
Closing Comparison Tools
Before closing out of Comparison Tools menu, be sure to click Reset to set all values back to their default state, toggle off Visual Diff Tool and Visual Check Tool, and clear out To Compare and Reference selection fields.

Make sure to uncheck or unclick all activated buttons in Comparison Tools.

3D View should return to its original state as shown in an example below.

Was this article helpful?
That’s Great!
Thank you for your feedback
Sorry! We couldn't be helpful
Thank you for your feedback
Feedback sent
We appreciate your effort and will try to fix the article