Export as PDF
This article describes how to create a report for a Cintoo project in a PDF format from Report tab, how to control the content of the report and what's inside the PDF report.
Permissions: users with roles including View Annotations permission can download an annotation report in PDF format.
TABLE OF CONTENTS
Description
In Report tab for each Cintoo project the default view shows the list of all activities done by all users in a chosen work zone (1), showing date of creation (2), name of the object (3) and creator (4). It's possible to show the details of the object by clicking on the arrows (5) on the right.
Note: content of Report tab depends on the work zone chosen in Work zone Explorer, as it serves as a filter. To view all the elements of the project, choose the root work zone.

This list includes:
Export as PDF green button is located on the top right of the screen.

Filtering
Content in the resulting PDF report could be additionally controlled by the filters located to the left of Export as PDF button.
There are 3 types of filters:
- by label (for annotations). Using labels as defined categories, location or issue types allows to get additional flexibility and customization when composing the report.

- by users who created an object

- by activities - type of the object

By default, Select all option is chosen in all 3 filters, meaning that all objects would be visible in the list and all would be included in the PDF report.
By setting up proper filtering options, the remaining objects will be included in the PDF report once a user clicks on Export as PDF button.
If the number of objects is big this might take time to generate a report. The report is then automatically downloaded in browser inheriting work zone name, where it was generated.

Header
- Report name - name of the work zone, where report was generated
- Exported date and user who exported the report
- Project information section with scan count, project creation date, last update date, coordinates and creator information.

- Different types of elements counter: Notes, Private Notes, Issues and Measurements. Each number is a clickable quick link to move to a corresponding report section.

- Next there are up to 4 sections dedicated to each type of element in the same order as shown above. Each of them has its own color code or icon assigned:
 Notes
Notes Private notes
 Issues
Measurements
Notes
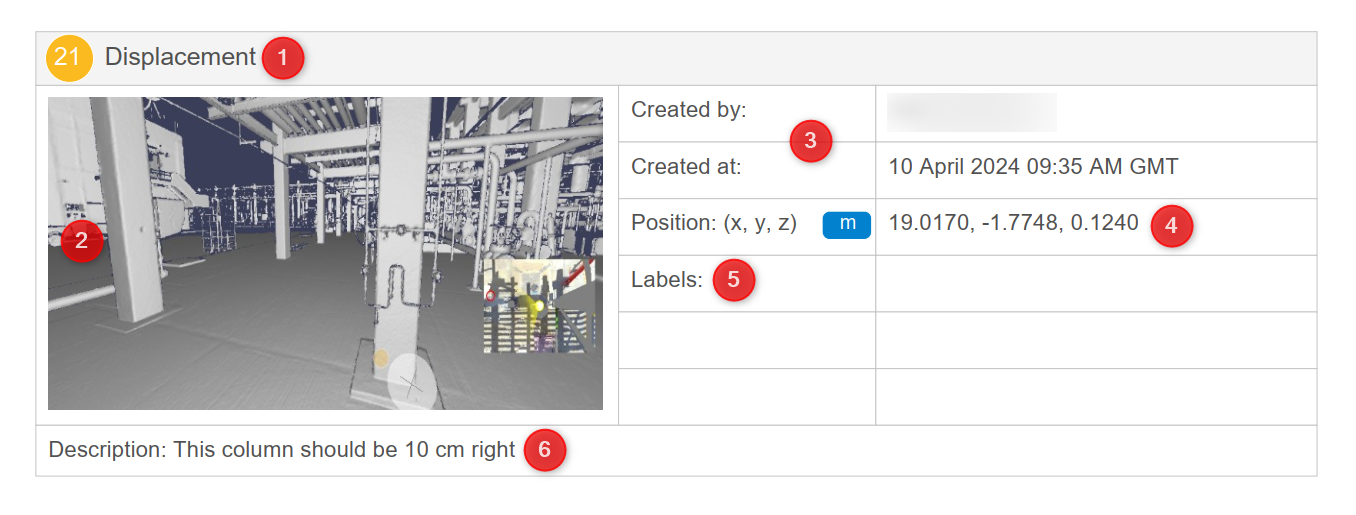
- Index number and Name
- 3D view captured with the Note
- Creation information (Creator and Date)
- Position with project units
- Labels if any
- Description
Private Note
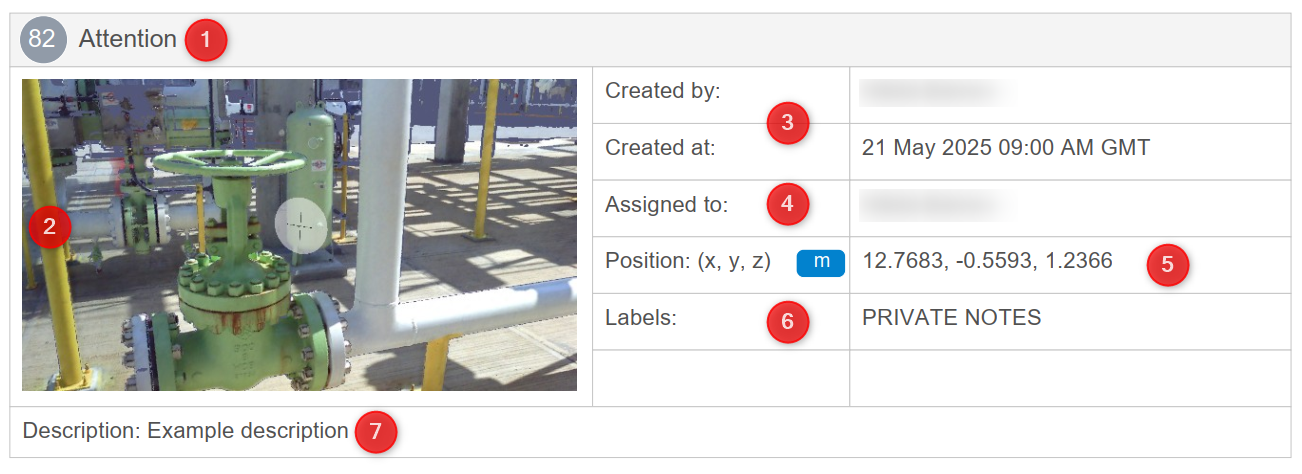
- Index number and Name
- 3D View captured with the Private Note
- Creation information (Creator and Date)
- Assignee
- Position with project units
- Labels if any
- Description
Issues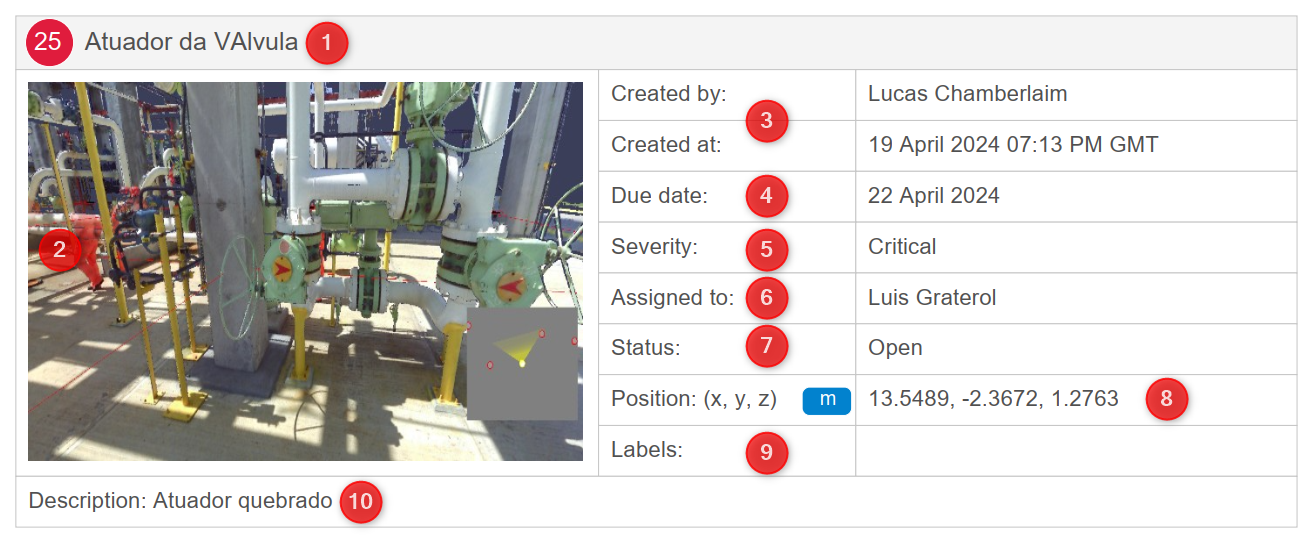
- Index number and Name
- 3D View captured with the Issue
- Creation information (Creator and Date)
- Due date - date when the issue is supposed to be resolved
- Severity (low, medium, high, critical)
- Assignee
- Status
- Position with project units
- Labels if any
- Description
Measurements (Linear)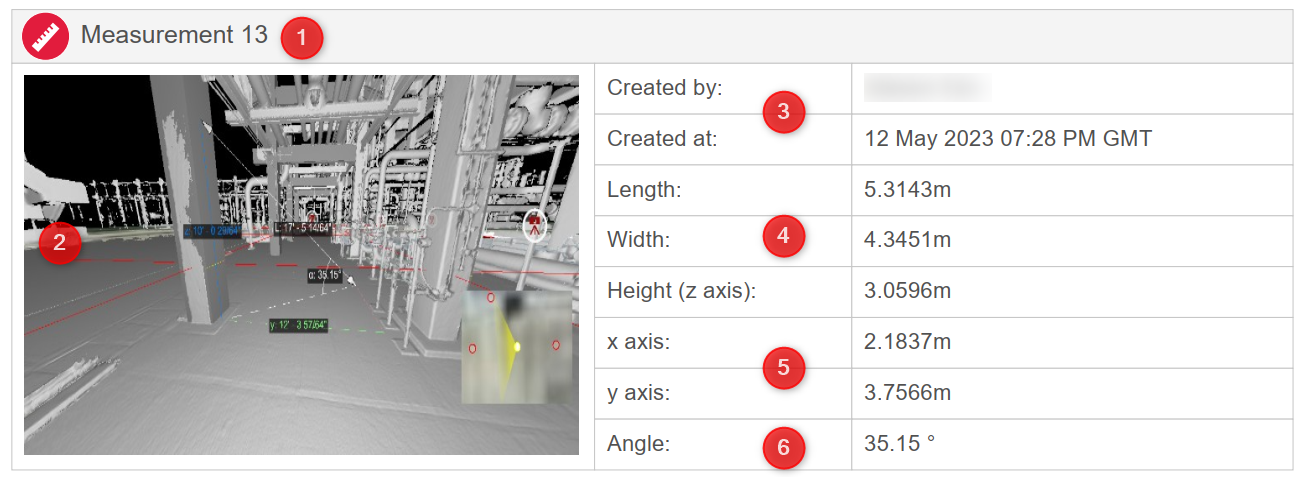
- Index number and Name
- 3D View captured with the Linear Measurement
- Creation information (Creator and Date)
- Length, Width, Height
- X axis, Y axis
- Angle
Measurements (Pipe)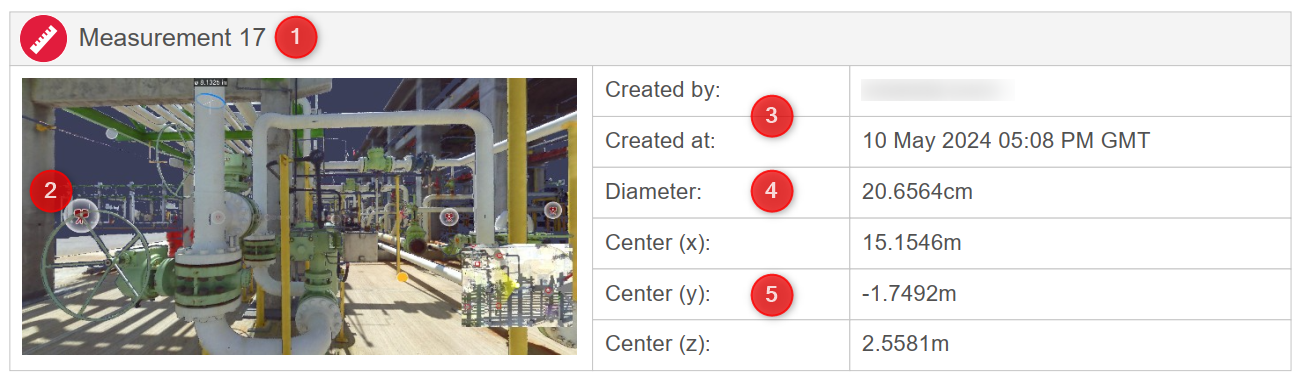
- Index number and Name
- 3D View captured with the Pipe Measurement
- Creation information (Creator and Date)
- Diameter
- Center X, Y, Z